
Spanish banks across the 2020–2025 rate cycle: Divergent margin drivers between SIs and LSIs
Six years of rate fluctuation reveal distinct asset-liability management strategies across Spanish banks. Funding costs drove margin gains during tightening, while asset yields regained primacy as rates normalised, with significant divergence between SIs and LSIs.
Abstract: The near six-year period from 2020 to mid-2025 offers a complete interest-rate cycle for analysing the evolution of Spanish banks’ net interest margins. After prolonged margin compression under zero or negative rates, the rapid monetary tightening of 2022–2023 enabled a recovery driven primarily by funding cost dynamics, followed by a more gradual adjustment as policy rates returned toward a “new normal” of 2%. Disaggregating the margin highlights an asymmetric adjustment between assets and liabilities: funding costs showed lower sensitivity during the tightening phase, while asset yields were more sensitive, driving margin expansion as rates moved lower, this pattern partially reversed, reducing the extraordinary boost from the liability side and restoring a more balanced contribution to margin generation. However, aggregate results mask structural differences between significant institutions (SIs) and less significant institutions (LSIs). During the tightening phase, LSIs exhibited higher starting margins and lower funding-cost, widening their advantage, whereas SIs sustained comparatively higher asset yields due to portfolio composition. Overall, the cycle confirms that margin resilience depends not only on rate levels but on institutional structure, balance sheet mix, and competitive dynamics in both credit and deposit markets.
Trend in the net interest margin in the context of rate cycle changes
Following a protracted period of deleveraging and recapitalisation after the financial crisis, the bank sector was obliged to operate for more than five years in an environment of extraordinarily low interest rates, compressing their margins structurally and limiting their ability to generate profits via their traditional borrowing-and-lending role. That scenario would then give way, in a few years, to a shift in monetary policy, shaped firstly by intense and swift increases in official rates, creating space for a recovery in net interest margins, and subsequently by an adjustment to an intermediate level of around 2%, currently viewed as the “new normal”. This complete interest rate cycle has had different implications for the banks’ ability to generate profits which is better understood by decomposing the net margin into the return earned on their interest-bearing assets and the cost of their liabilities relative to Euribor during the different sub-periods analysed.
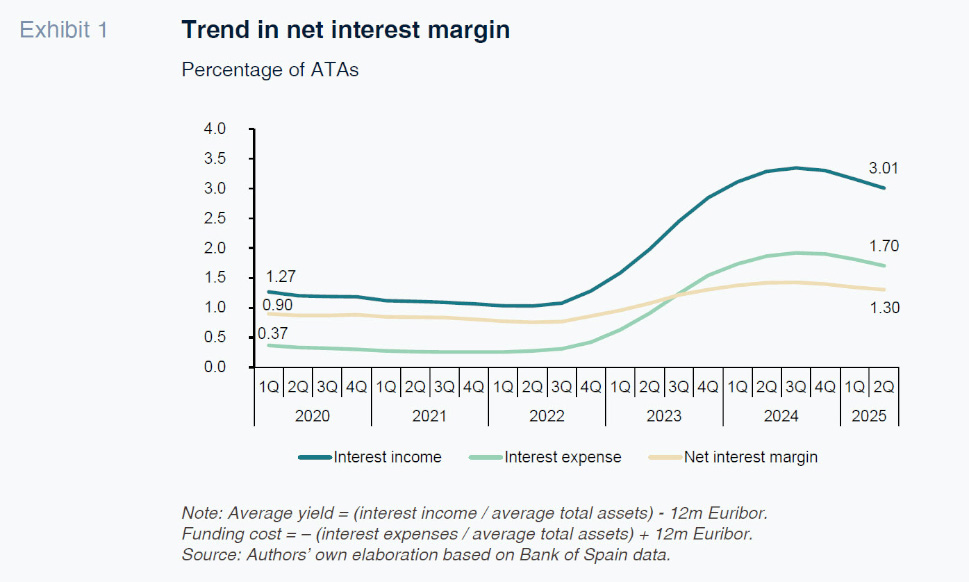
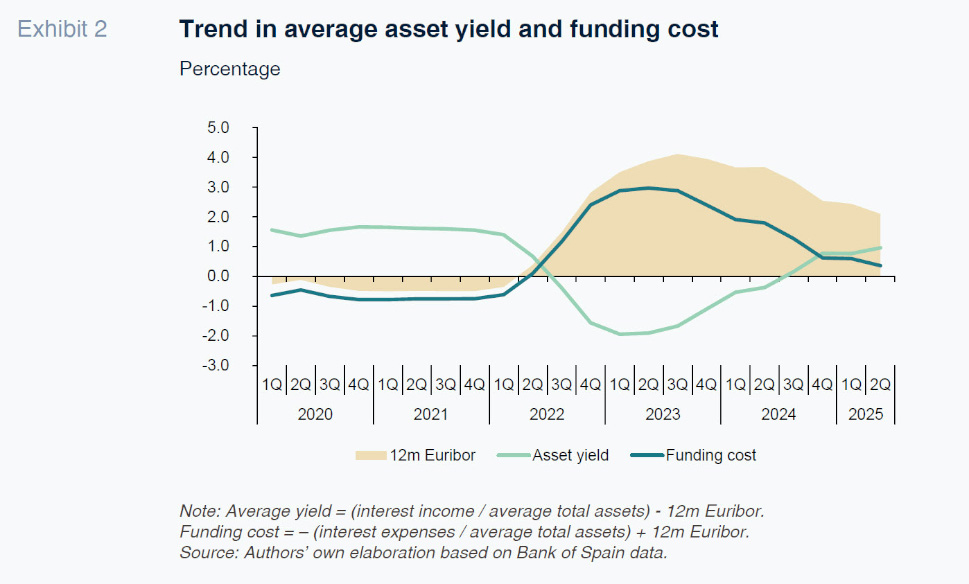
Between 2020 and 2021, the Spanish bank sector operated with slim net interest margins, as shown in Exhibit 1, with profitability gradually tapering to just below 0.9% of average total assets (on an unconsolidated basis), according to the data published by the Bank of Spain. Looking to Exhibit 2, in the context of zero or even negative rates since 2015, the banks’ inability to cut deposit rates below zero meant that the contribution to the net margin via the liability side of the equation was very limited or likewise negative. In practice, it was the yield earned on their assets, understood as the spread applied to the banks’ loan and fixed-income portfolios relative to Euribor, that allowed the banks to continue to generate profits as households and businesses continued to leverage and the banks continued to digest non-performing assets.
From the second half of 2022, the spike in inflation and ensuing official rate increases by the European Central Bank (ECB) triggered the start of a phase of margin recovery. As analysed in earlier papers (Alberni et al., 2022), the lag between asset versus liability repricing was key during this phase. The rate increases squeezed the spread on assets over Euribor. Initially, the increase in Euribor had a positive impact due to the increase in the rates applied to new lending transactions and the significant weight of the portfolio benchmarked against floating rates. However, these tailwinds were not sufficient to make up for the customary lag in the pass-through of higher rates to the entire credit portfolio, exacerbated by shrinkage in the stock of household and business credit in 2022 and 2023 and the initially more inelastic response in returns on the fixed-income portfolio, marked by a majority skew towards a held-to-maturity model.
In the meantime, the cost of funding headed in the other direction. The average funding cost, particularly the cost of customer deposits, remained well below Euribor throughout the cycle and repriced with a lag, due to the existence of ample surplus liquidity across the system, easing competitive pressure around the rates offered to capture savings during this period. As a result, the spread between funding costs and the benchmark rate of interest widened. The combination of the two trends explains why the aggregate net interest margin did not peak until the second quarter of 2024, when it reached just over 1.4% of average total assets.
The ECB’s decision to embark on rate cuts in June 2024 marked a new turning point for the trend in the net interest margin, which started to correct very gently from the peak, albeit remaining well above the level observed at the start of the period under analysis. During this phase, the yield on assets eked out somewhat of a recovery thanks to the drop in Euribor, which eased pressure on the spread over the benchmark index. In addition, the advent of renewed growth in the stock of credit in 2025, particularly in the retail banking segment, together with the delayed pass-through of the rate increases to returns on the fixed-income portfolio, may have helped mitigate the effective reduction in investment returns. However, the support provided by the funding cost began to slip. The reduction in official rates was not passed through symmetrically to deposit rates, which were high relative to the period of negative rates, so that the spread over Euribor started to narrow. As a result, the liability side of the equation began to lose the extraordinary momentum observed during the period of rate hikes, converging towards a more neutral role, while the asset side gradually recovered its traditional relative role in margin generation.
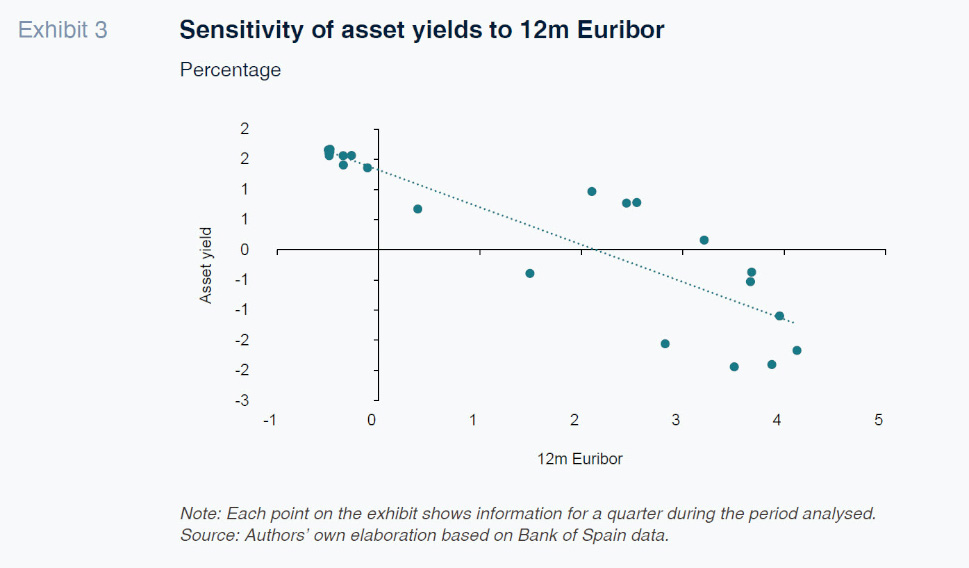
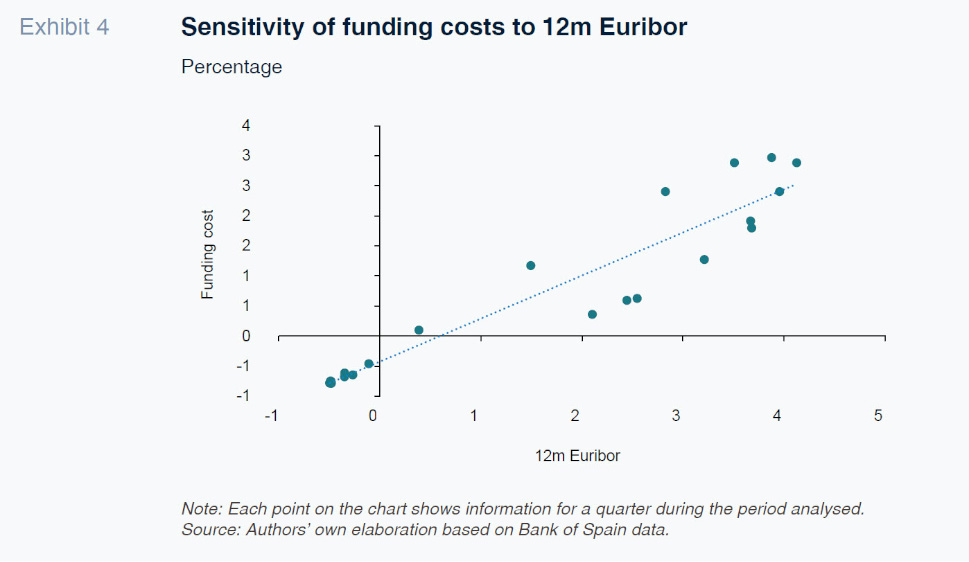
Overall, the results reveal that the relative contribution of assets and liabilities depends critically on the stage of the benchmark rate cycle. As illustrated in Exhibits 3 and 4, the sensitivity (“beta”) of the asset yield is negative relative to 12m Euribor (-24bp for every 1% increase), while the cost of funding is positively and more strongly correlated (beta: +45bp). This means that for every 1% increase in Euribor, the compression in the asset spread is more than offset by the improvement in the liability spread, generating a net positive impact on the aggregate net interest spread. During a period of rate cuts, realising that the sensitivities to movements in Euribor are not symmetric all across the entire sample, the mechanism would work in the opposite manner, yielding an improvement in the asset spread, partially alleviating the deterioration in the liability spread, albeit without fully neutralising it. As a result, and as borne out by Exhibit 2, the banks’ net interest margin has been “fed” by funding costs when rates were high, whereas when rates were low, only asset yields made a positive contribution to the net margin.
Contrasting responses during the full rate cycle: SIs versus LSIs
Having analysed the recent trend in the aggregate net interest margin for the Spanish bank system, our next task is to analyse whether the trends identified were uniform across the banks or, to the contrary, there were contrasts. To do so, we examine possible differential effects as a function of entity type by drawing a comparison between the significant and less significant institutions [1] in a bid to identify how the structural characteristics of each group may have conditioned their ability to generate margins over the course of a full rate cycle.
a) Trend in net interest margin during period of rate increases
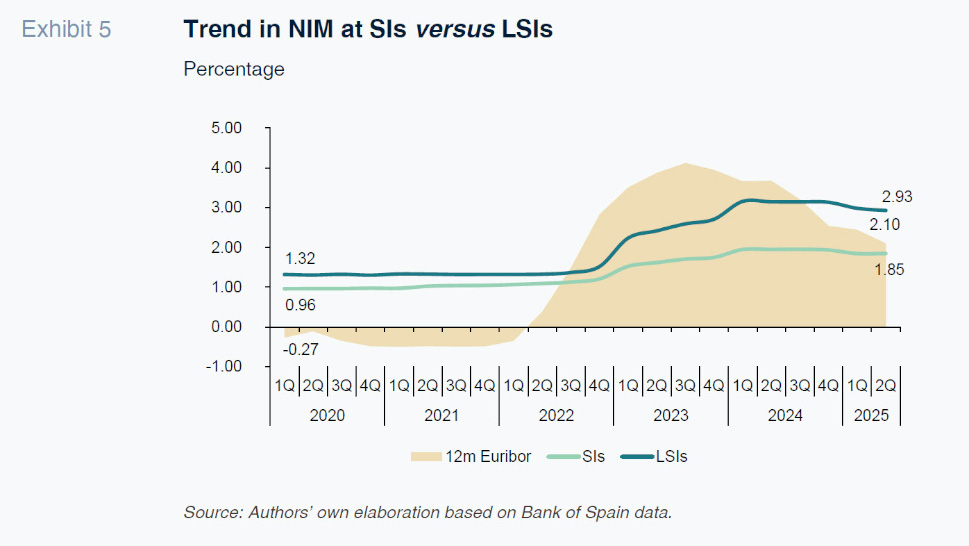
According to the patterns depicted in Exhibit 5, when rates were going up, the SIs and LSIs presented well differentiated trends in terms of net interest margin (“NIM”). Specifically, the LSI aggregate analysed started from a structurally higher NIM before the start of the rate tightening and, throughout that phase, consistently presented a systematically higher margin compared to the SI composite. Moreover, this group’s margin etches out a considerably steeper slope after the start of the rate increases, suggesting a greater ability to leverage the new rate environment and translating into a higher cycle beta. The combination of a higher starting point and greater sensitivity to the cycle meant that by the end of the period of rate tightening, the gap between the two groups’ margins was wider than at the start of the period analysed.
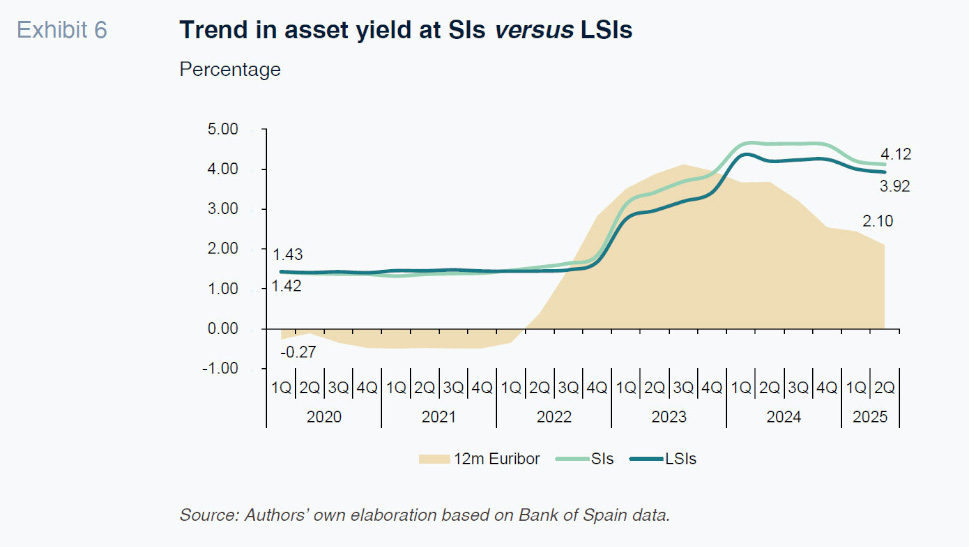
This warrants deeper analysis into the trend in each component of the net interest margin for the two types of institutions. Looking at the asset yield (Exhibit 6), the comparison is slightly more favourable for the universe of SIs, which react a little sooner and more intensely than the LSIs, indicating greater sensitivity to the rate cycle on the asset side. In margin terms, this translates into smaller asset yield compression relative to Euribor at the SIs than at the LSIs. This better ability to sustain asset yields is explained by portfolios with a less pronounced skew towards fixed-income portfolios (which account for around 19.2% of total assets at the SIs, compared to 24.7% for the LSI sample). The corollary is a relatively bigger share of credit at the SIs, and within this, higher relative exposure to the business and consumer lending segments.
The higher assumption of credit risk associated with these segments and the higher percentage of transactions arranged at rates that are more sensitive to the cycle and with shorter average maturities than in other segments like the mortgage segment (where the loan term averages around 25 years) is conducive to faster and fuller pass-through of rate increases to asset returns. In contrast, at the LSIs, the higher share of household mortgages, where competition is fierce, leaving tighter spreads in its wake, coupled with higher exposure to SMEs than to large enterprises, exerts pressure on the trend in their interest income and, by extension, their asset yields. By the same token, the higher weight of fixed-income securities at the LSIs further conditions their earnings performance as the securities in these portfolios tend to be largely fixed-rate. This, coupled with a limited ability to rotate these assets, whether due to accounting considerations or structural balance sheet risk management factors, reinforces this negative impact on asset yields, as is borne out by the previously analysed patterns.
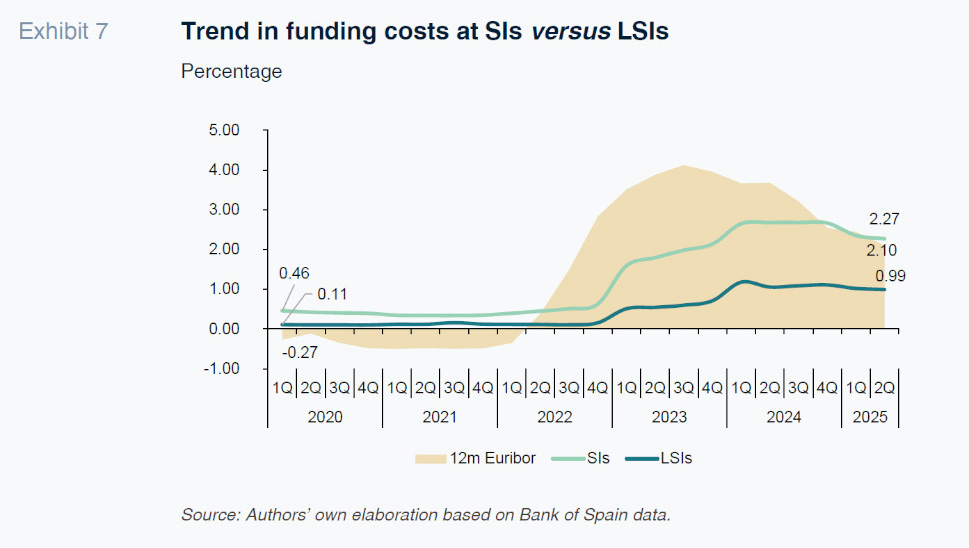
However, the biggest difference in the NIM trend between SIs and LSIs is unquestionably in funding costs (Exhibit 7). The LSIs have consistently kept their funding costs considerably below those of the SIs, a difference only heightened during the period of rate increases. In margin terms, this translates into more pronounced widening of the funding cost spread relative to Euribor at the LSIs. On the other hand, the significant institutions experienced an earlier and sharper increase in funding costs than the LSIs, evidencing greater sensitivity of funding costs to the rate environment, shaped largely by the SIs’ greater reliance on the wholesale funding markets.
As for retail market funding, the presence of significant institutions in markets where competition is more intense and, in general, whose customers are more sensitive to the rates offered for their savings, put additional pressure on deposit costs for these banks, curbing the scope for a bigger improvement in funding costs. By comparison, the proximity banking model that predominates at the LSIs affords them a more granular and highly stable deposit base and gives them more liquidity, allowing them to curb deposit rates and maximise the spread relative to Euribor.
b) Trend in net interest margin during the period of rate decreases
During the last phase of rate cuts and stability, the NIM has corrected more intensely at the LSIs than at the SIs. In sensitivity terms, this is aligned with a higher beta again at the LSIs during rate tightening, whose NIM corrects by proportionately more, albeit preserving somewhat of an advantage over the SIs.
In terms of interest income, the growth in loan books at both groups of institutions has slightly mitigated the negative effect of the downtrend in benchmark rates. Nevertheless, the SIs are managing to keep their asset yields above those of the LSIs, which is consistent with their greater exposure to segments with higher credit risk, allowing them to preserve somewhat wider spreads even when rates are falling. This pattern is consistent with the trend described by the Bank of Spain for the non-financial corporation (NFC) segment (Medrano and Salas, 2025). In that analysis, the authors infer greater price-setting ability in this segment in recent years, whereby the loan portfolios in the NFC segment partially mitigate the downward pressure on interest income at times when rates are coming down, helping to preserve the observed higher profitability levels.
In addition, the correction in interest income in the case of the LSIs may be being exacerbated by their relatively larger liquidity positions, in line with the gradual reduction in the remuneration offered to place these balances at the Deposit Facility, limiting their ability to sustain income levels in a context of rate cuts.
Again, however, the bigger discrepancy is observed in funding costs. The SIs continue to bear a higher funding cost than the LSIs, consistent with a funding model more reliant on wholesale funds, as well as issues related with regulatory demands. During the recent period of rate cuts, however, they managed to cut their funding costs more intensely, thanks to both lower issuance costs and more active management in many cases of term deposit renewals, taking advantage of maturing deposits to gradually lock in lower remuneration rates. This is consistent with the previously mentioned lower funding cost sensitivity enjoyed by this group, allowing them to pass through to a lesser degree the successive negative impact on that cost of Euribor decreases in relative terms, whereas for the smaller sized institutions, the extraordinary contribution provided by the rate increases corrected more sharply.
At the LSIs, in contrast, the smaller correction in funding costs is shaped by the lower remuneration offered for customer deposits, providing a sort of floor for the drop in costs and restricting the room for manoeuvre. This may have impeded the scope for passing through the reduction in official rates with the same zest as the SIs, as is borne out by our analysis of the betas for the two groups, resulting in a sharper drop in margin generation on the funding side.
Conclusions
Our analysis reveals that the full rate cycle observed over the past five years has had considerable effects on the trend in the banks’ net interest margins and, specifically, on the two underlying components. The intense upfront increase in rates from 0% to 4%, since when they have trended down to 2%, considered the “new normal”, has cemented a structural improvement in the upper part of the banks’ income statements, buoyed initially by funding costs, which displayed considerable positive sensitivity during the period of rate increases, and, later, by a growing contribution by asset yields as interest rates tapered.
This aggregate trend masks considerable differences between the significant and less significant institutions. The latter benefitted more via funding costs when rates were higher, whereas the SIs exhibited a comparative advantage in terms of asset yields, which made a proportionately bigger contribution as rates fell.
In the coming quarters and years, however, the banks’ ability to defend their margins in absolute terms will depend on ongoing momentum in credit, which started to recover in 2025, particularly in the segments more conducive to generating higher spreads.
Notes
To analyse the LSIs as a group, we took a representative sample of 20 Spanish financial institutions.
References
ALBERNI, M., BERGES, Á., and RODRÍGUEZ, M. (2022). EURIBOR increases into improved banking margins: Differential timing on asset and liability repricing.
SEFO-Spanish and International Economic & Financial Outlook, Vol. 11(5) (September).
https://www.sefofuncas.com/pdf/Alberni-11-5-1.pdf MEDRANO, L., and SALAS, V. (2025). Consolidación bancaria y márgenes de las operaciones bancarias de préstamos y depósitos de las sociedades no financieras en España.
Revista de Estabilidad Financiera–Banco de España, 49, otoño.
https://doi.org/10.53479/41870
Marta Alberni, Ángel Berges and Laura Ciriza. Afi